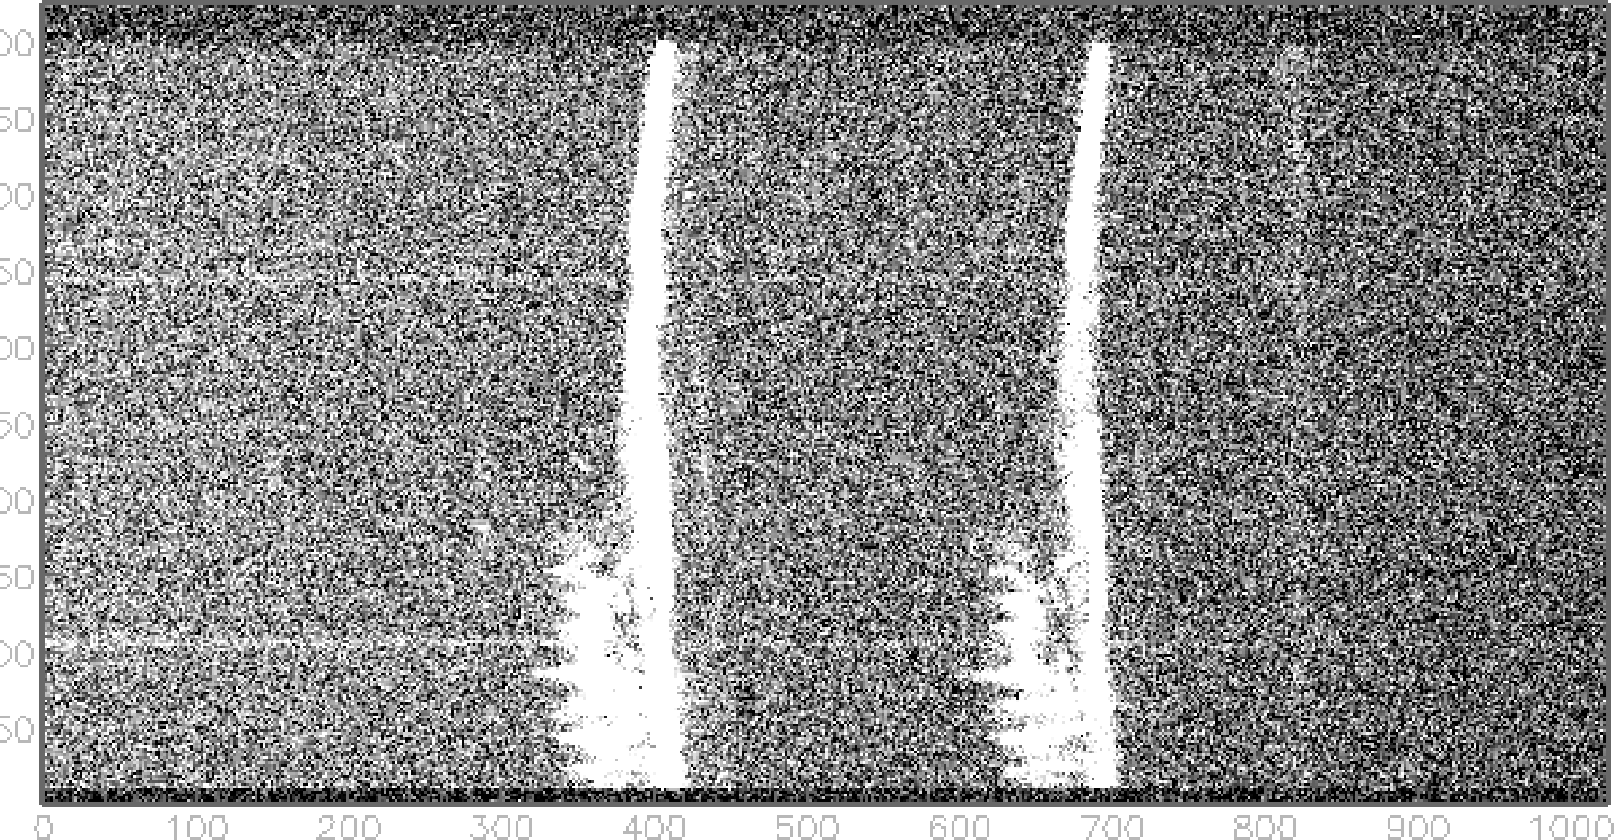
Figure 1: Basic characteristics of a simple 1-D spectrum.
If we divide up the light collected from an astronomical object by wavelength the result is a spectrum. What use is this? We can derive a great deal of information about the object we are looking at: chemical composition, velocities, temperatures, and densities.
Figure 1 shows some of the features of a typical spectrum. These data were recorded in the manner most commonly used: with a CCD. You can see some cosmic-ray features (bright spots caused by cosmic rays hitting the detector), as indicated by the label ‘CR’, and there are some night-sky lines (bright features in the spectrum of the light coming from the sky) running vertically across the spectrum.
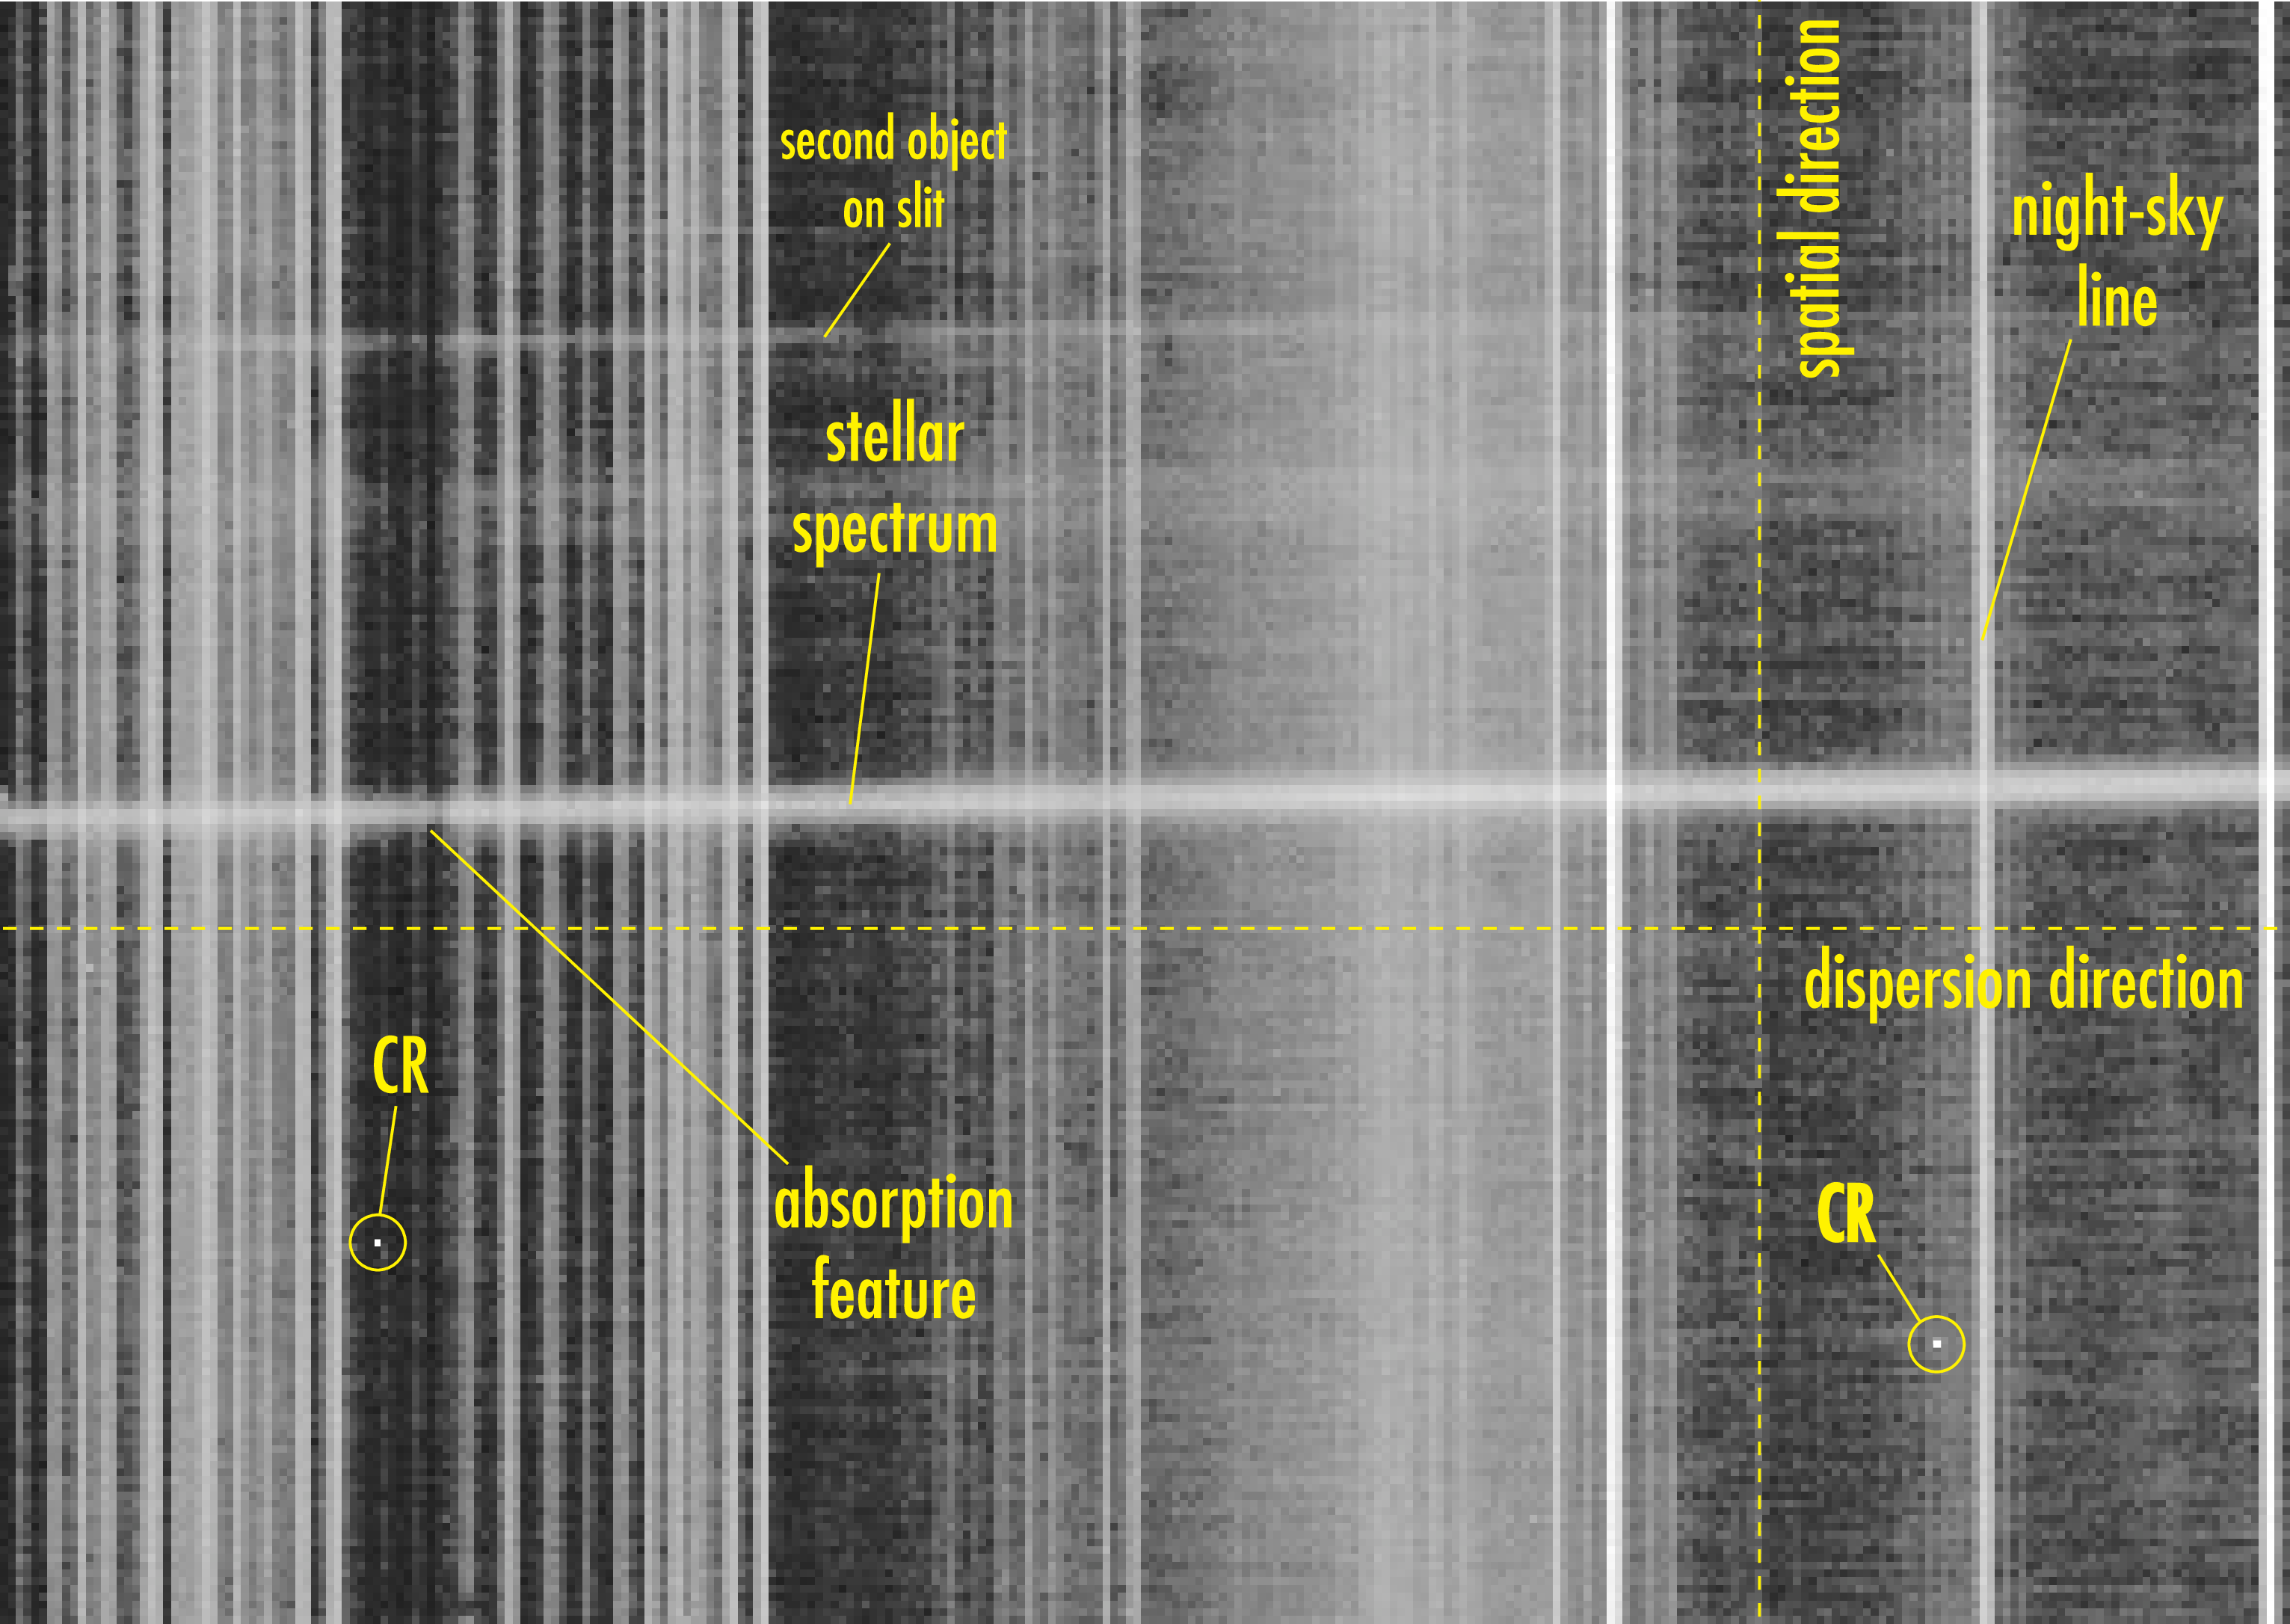
Longslit spectroscopy produces CCD image frames which have essentially the same features as are present in 1-D spectra (see Figure 2. The difference arises when the slit is placed over an extended object and then an individual spectrum for each pixel row along the slit length is obtained.
For consistency, all spectra discussed in this document are arranged as in the above figures; the dispersion direction is oriented roughly parallel to the X-axis, the spatial direction parallel to the Y-axis.